Diagnostics Window (just:in v2.5)
Once just:in Engine has been configured properly and the Channels have been started, the Diagnostics Window shows the Status of the Channels and the Engine.
Showing the Diagnostics Window
- Go to the menu Window.
- Select Diagnostics.
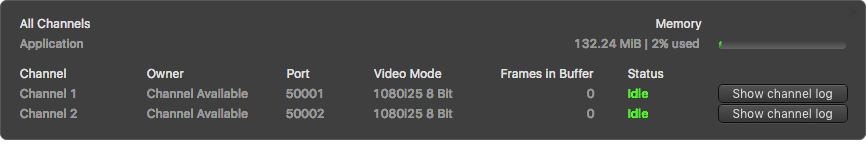
- Memory (upper right): displays amount of currently used RAM. The color of the usage bar changes accordingly to the amount of RAM used. If it constantly stays red, please review the system requirements and add more RAM to the machine.
- Channel: Name of the Channel, as defined in the Channels Tab in the just:in Engine Preferences.
- Owner: shows the name of the just:in user interface client which is currently connected to the particular Channel. If there is no connection it reads Channel Available.
- Port: Port of the Channel, as defined in the Channels Tab in the just:in Engine Preferences.
- Video Mode: Video Mode of the Channel, as defined in the Channels Tab in the just:in Engine Preferences.
- Frames in Buffer: displays how many frames are currently buffered. Values below 100 are usually good, if the value stays above 100 constantly, please review the system requirements and check your configuration.
- Status: displays whether the Channel is currently Idle or Recording.
- Show channel log: when troubleshooting or when the ToolsOnAir technical support needs to help you, the Channel Logs come in handy. Press the Show Channel Log button to display the log of the corresponding Channel in the Console application of the operating system.
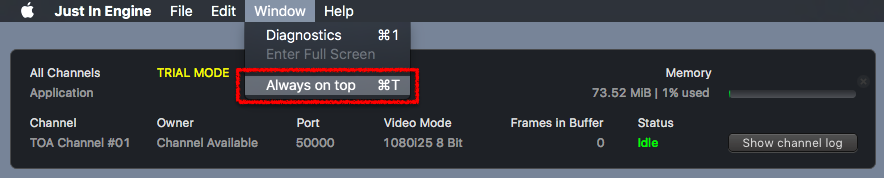
Diagnostics Window always on top
You can make the Diagnostics Window always stay on top of other Applications. Select the menu Window → Always on top or use the shortcut command + T.